Throughput is an Azure DevOps (ADO) dashboard widget that shows how many work items your team completes over time — by sprint, month, or quarter.
Items are grouped into buckets by closed date, so the visual updates automatically as work completes — no need to set iteration paths or tags.
Throughput shows trends at a glance: are you shipping more or less? Are completions even or bursty? Where does the current interval stand right now?
Confession: I can’t tell you how many times I wrote six queries and dropped them into six query tiles to show throughput on a dashboard. This widget replaces that — one configurable visual, faster to set up and easier on the eyes.
Installing Throughput
Install Throughput from the Microsoft Visual Studio Marketplace.
Installation requires organization-level permissions; if you don’t have them, ask your ADO administrator.
The extension uses vso.work scope — read-only access to work items — and does not send data outside your ADO organization.
Once installed, add the widget to any dashboard:
- Edit the dashboard (Edit in upper right).
- Click in the Search widgets input.
- Type Throughput.
- Double click on Throughput.
- Configure the widget — see Configuring the widget below.
How bucketing works
Throughput groups work items into buckets by their closed date, not by iteration path.
When you select Sprint as the interval, each bar represents one of your team’s sprints. A work item shows up in a sprint’s bar if its Closed Date falls between that sprint’s start and end date, regardless of which iteration path was set (or whether one was set at all).
This is different from velocity widgets, which count items that were set to a sprint’s iteration path. That requires every work item to be correctly assigned before the sprint ends, or it doesn’t show up — a discipline that’s easy to forget.
Throughput uses closed date instead, so:
- An item assigned to no iteration still counts in whichever sprint window it closed in.
- An item assigned to the wrong iteration (someone forgot to update it) still counts where it actually closed.
- An item assigned to a future iteration but closed early still counts now.
Example. Say your team has Sprint 47 running April 1 – 14 and Sprint 48 running April 15 – 28.
- Work item #123 was assigned to Sprint 47 but closed on April 18. It appears in Sprint 48’s bar.
- Work item #124 was assigned to no iteration but closed on April 5. It appears in Sprint 47’s bar.
- Work item #125 is assigned to the current iteration but is still open. It does not appear yet — it only counts once it’s closed.
The same logic applies to Month and Quarter intervals — items count into the month or quarter of their closed date.
Especially useful for Kanban teams working alongside Scrum teams. Service teams (platform, DevOps, design, security, etc.) often work in continuous flow supporting Scrum teams that work in sprints. With closed date bucketing, Kanban teams can show their work in the org’s sprint cadence — using the shared sprint calendar without having to set a single work item’s iteration path. Shared language, easier coordination, no extra work.
Configuring the widget
When you open the widget’s configuration pane, you’ll see:
- Team — the team whose work the widget will show. Defaults to the dashboard’s team. Switching teams refreshes the rest of the controls below.
- Backlog Level — which level of work items to count: Epics, Features, or Backlog Items (User Stories / PBIs, etc. depending on your process template), or Tasks. Defaults to Backlog Items — that’s where throughput is most commonly measured.
- Interval — Sprint, Month, or Quarter. See How bucketing works above for what each one means.
- Number of intervals — how many bars the visual will render (3 to 26). Default is 12.
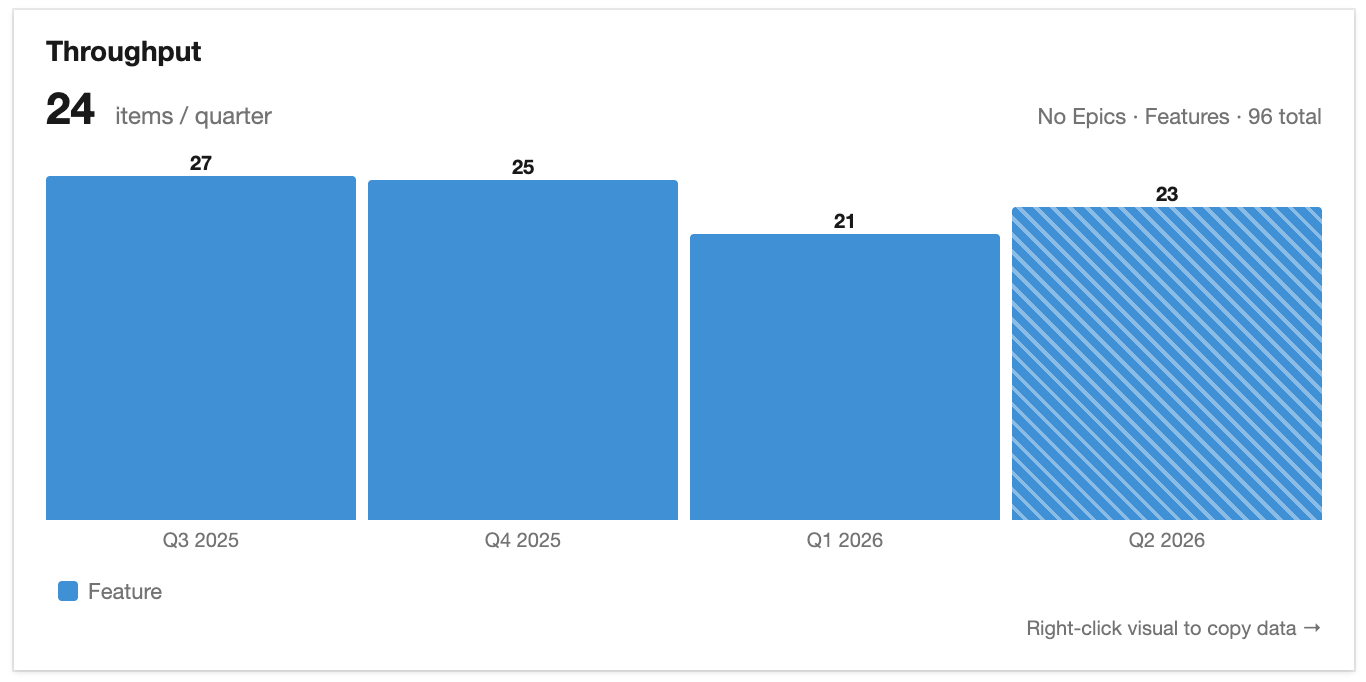
- Show breakdown by work item type — when on (default), bars are stacked by type with a legend. When off, bars use a single blue color showing total throughput — useful for compact “report-out” views where the per-type breakdown isn’t needed.
If your team doesn’t have an active sprint schedule, the Sprint option is disabled with a hint to set iterations or pick Month or Quarter instead. If your team has fewer started sprints than the number of intervals you requested, a caption appears below: “Visual will show X of Y sprints, more as sprints complete.”
Reading the visual
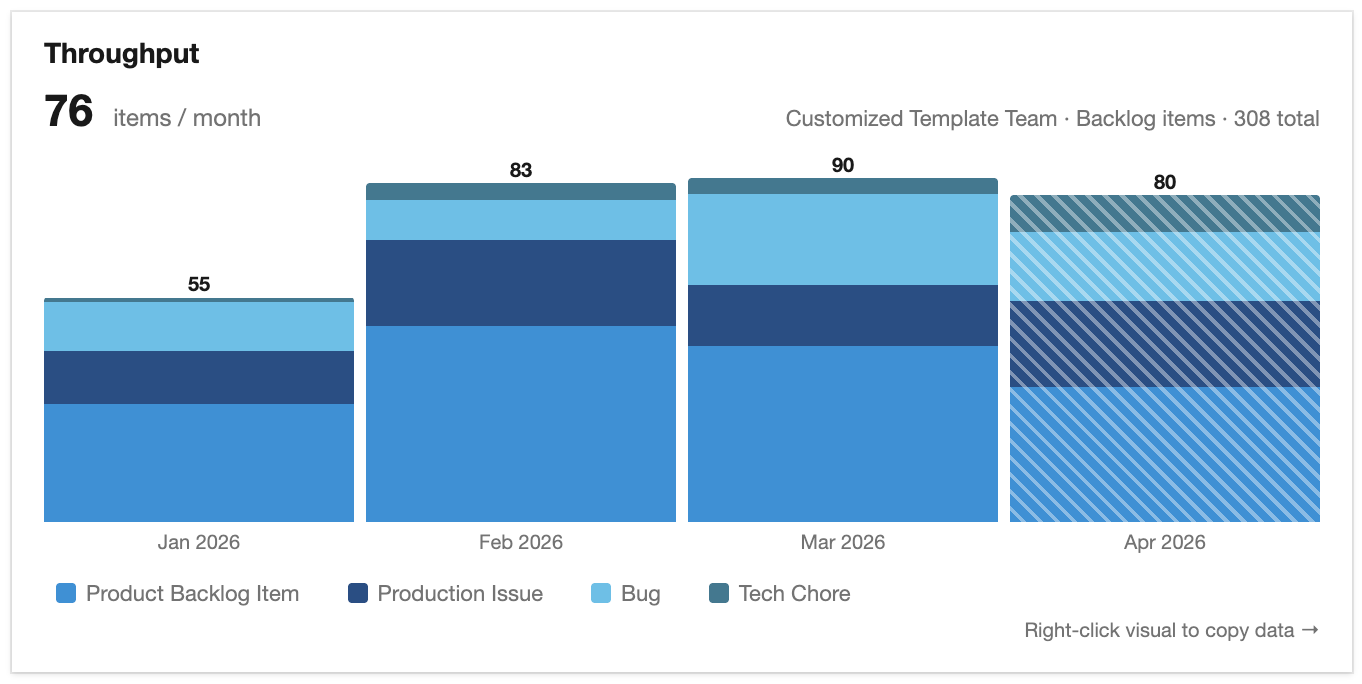
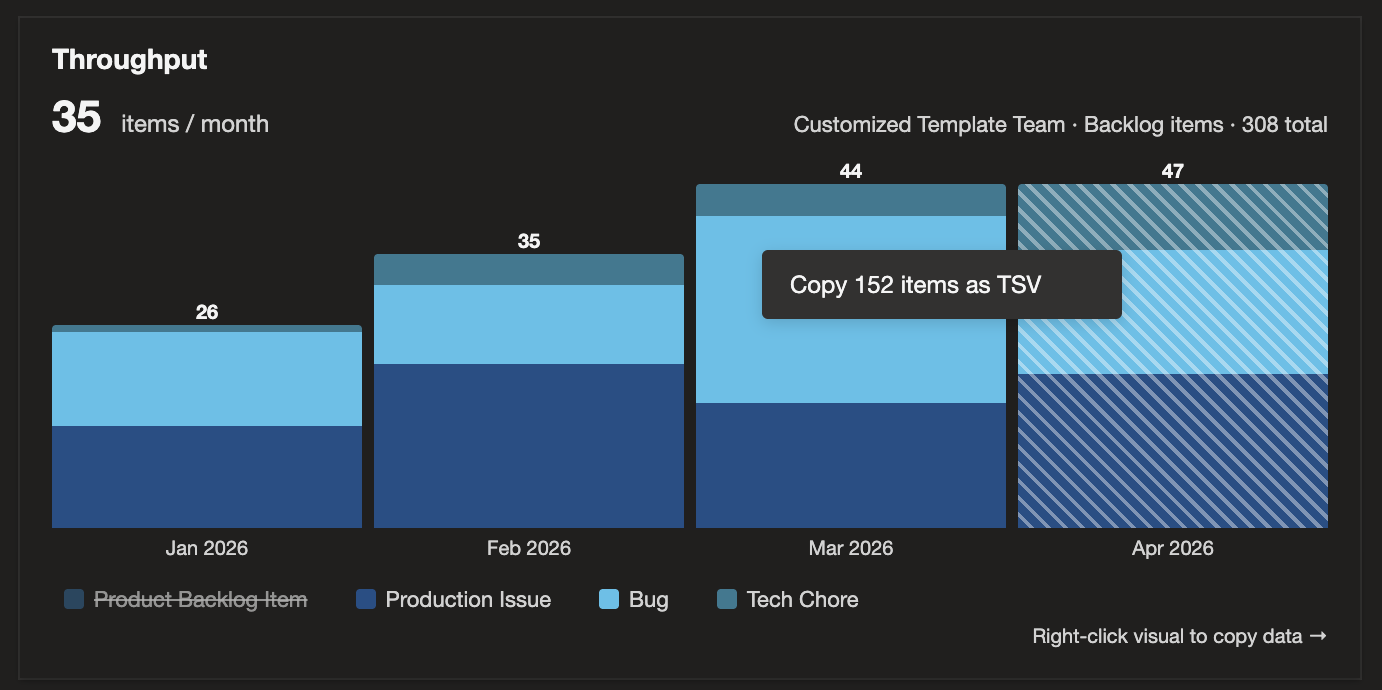
Headline. The big number above the visual shows your team’s mean items per interval, excluding the current in-progress interval (so a partially completed sprint doesn’t drag the average down).
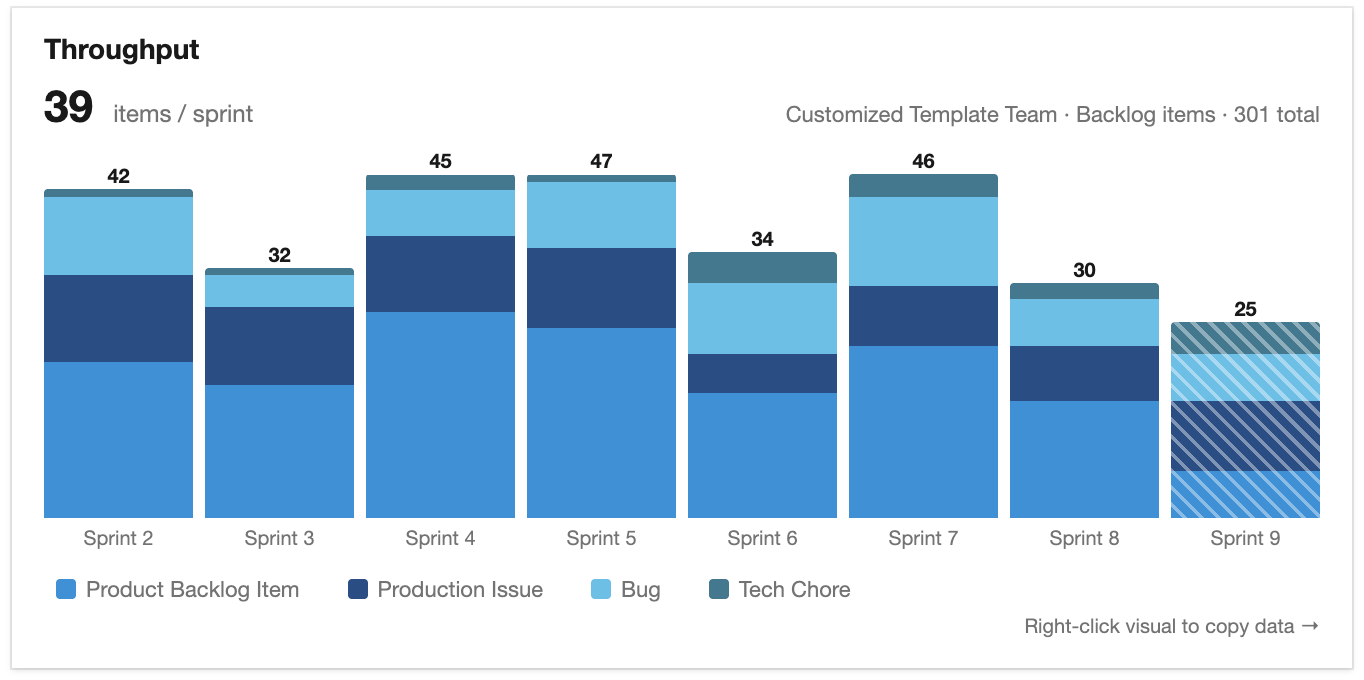
Bars. Each bar is one interval — sprint, month, or quarter — sized to its total item count. The leftmost bar is the oldest; the rightmost is the most recent.
In-progress marker. The current (rightmost) interval is shown with diagonal hatching when it isn’t yet complete. The hatch indicates that this bar’s count is still accumulating — items closed before today are counted; items closed today or later will join as they happen.
Show breakdown by work item type. When the breakdown toggle is on, each bar is stacked by work item type, with the primary type at the bottom (in blue) and others stacked above. The legend below the visual names the types in order of first appearance.
Hover for details. Hover any bar to see its date range, per-type breakdown, and total. The tooltip shows per-type counts regardless of the breakdown toggle setting — the breakdown toggle controls the visual; the tooltip always gives the full picture of the currently-visible types.
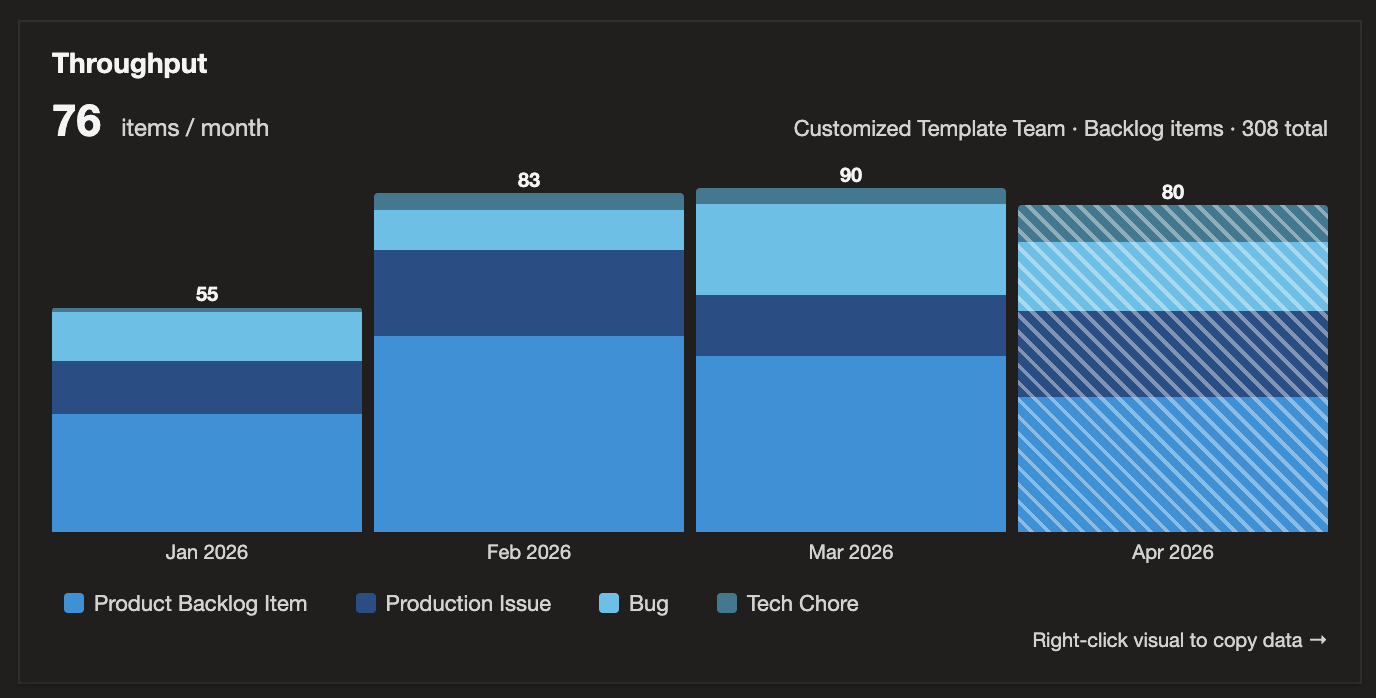
Light and dark mode. The visual tracks your ADO theme automatically — colors, backgrounds, and text contrast adapt without any configuration on your part.
Filtering and exporting
Click the legend to filter by type. When the breakdown is shown, each entry in the legend below the visual is a clickable toggle. Click an entry to hide that work item type from the visual — the bars resize, the headline recalculates, and the tooltip shows only what’s visible. Click it again to bring the type back. Hidden entries stay in the legend with a dimmed swatch and strikethrough label so you can see what’s filtered out at a glance.
This is the fastest way to compare ratios across time. Hide PBIs to see only Bugs, Production Issues, and Tech Chores side-by-side. Hide everything except Bugs to see one type’s trend in isolation. At least one type stays visible at all times — the last entry is locked, since a blank visual has no value.
Right-click to copy items as TSV. Right-click anywhere on the visual and choose Copy {N} items as TSV. The visible items — filtered or not — go straight to your clipboard, ready to paste into Excel, Google Sheets, or any spreadsheet tool. Each row carries 15 columns:
ID, Title, Type, State, Created Date, Activated Date, Closed Date, Bucket, Bucket Start Date, Bucket End Date, Bucket Status, Assigned To, Tags, URL, Area Path.
- The three lifecycle dates (Created → Activated → Closed) sit adjacent so you can derive lead time and cycle time per item with a simple column subtraction in your spreadsheet.
- The Bucket Status column reads “Complete” or “In progress” so spreadsheet
AVERAGE()formulas can match the visual’s headline by filtering to completed buckets only. - URLs auto-linkify in Excel after you press Enter on a URL cell, turning the export into a clickable navigation table back to ADO.
Filter by type and right-click to copy pair naturally: filter the visual down to just the types you care about, then right-click to copy exactly that subset. Want just Production Issues over time? Filter the legend, right-click, paste — done.
Common questions
What does Throughput write to my work items?
Nothing. Throughput is read-only — it queries existing work items by closed date and renders the visual. No tags, comments, fields, or relationships are modified. The only stored state is the widget’s configuration (team, backlog level, interval, etc.) on your dashboard.
Does Throughput work with Azure DevOps Server (on-premises)?
Officially supported for Azure DevOps Services (cloud). The marketplace listing targets the cloud edition; the plugin isn't currently distributed through the on-premises marketplace. There are no known technical limitations that would prevent it from working on Azure DevOps Server, but I haven't validated it against the on-premises edition. If you need on-prem support, contact me and we'll work through it together — likely starting with a version check (the modern Azure DevOps Extension SDK that this plugin uses requires Azure DevOps Server 2019 or later).
Does Throughput support my custom work item types?
Yes. Custom types from your process template (Production Issue, Tech Chore, anything else your team uses) stack alongside standard types in the visual, with palette colors assigned automatically — no widget-level config needed.
Will Throughput work with rollups of multiple teams?
Yes — through Azure DevOps’s native team configuration. Throughput is configured per team (one widget = one team’s completions), but ADO’s “team of teams” pattern is fully honored: if your team’s area path is configured in Project Settings → Teams → [Team Name] → Iterations and area paths → Areas with Include sub areas, the widget shows the combined throughput of all teams below that area path automatically. To compare sibling teams instead of rolling them up, add one Throughput widget per team to the same dashboard and configure the team for each widget as desired.
Why is the rightmost bar shorter and striped?
That’s the current in-progress interval. Its count includes items closed so far; more will accumulate as the sprint, month, or quarter progresses. The diagonal stripes mark it as still-accumulating so you see its lower count as partial completion instead of as a problem.
Why do I see “No current sprint” in the visual header?
Your team’s iteration schedule has no sprint covering today’s date. Either the team needs new iterations configured (in Team Settings → Iterations), or you need to switch the widget configuration to Month or Quarter.
Why does the visual say “No completed items in this timeframe”?
The widget queried successfully but found no work items that closed during the visual’s date range. Common causes: wrong team selected, wrong backlog level (e.g., Tasks selected when your team works at the PBI level), or no work was completed in the timeframe.
Why does Sprint mode show fewer bars than I asked for?
The visual can only show as many sprints as are configured for your team. The config caption — “Visual will show X of Y sprints, more as sprints complete.” — tells you about this at setup time. As new sprints start and complete, the visual fills in.
Why are some bars empty?
Empty bars (thin gray strips at the baseline) mean the team had no completed work in that interval. In Month and Quarter modes, this often shows pre-history (the team hadn’t started yet) or quiet periods (holidays, between-project gaps). Empty bars are excluded from the headline average so quiet periods don’t drag the mean down — what you see in the headline is the team’s typical throughput when actively working, not an average diluted by zeros.
Why did my legend filters disappear when I switched teams?
Legend filters apply to the type set in the data you’re currently looking at. When you change the team, backlog level, interval, or number of intervals, the underlying data set can include different types — so the filter resets to “all visible.” Toggling the breakdown checkbox preserves the filter, since it doesn’t change the data, only how it’s drawn.
How do I refresh the widget?
The widget refreshes automatically when the dashboard loads. For a manual refresh, press the refresh icon (circular arrow) or refresh the browser.
Getting direct help
Email me directly. Use the contact form and describe:
- The problem you experienced.
- Steps to reproduce it.
- Expected vs. actual behavior.
- Any other relevant context.
Ask publicly. The extension’s Q&A tab on Marketplace is good for questions you’re happy having others find and benefit from. I answer those too.
Other free AgileViz plugins
While you're here, browse the AgileViz plugin portfolio:
- Blocker Buddy — Capture why and how long your team's work is blocked, with a per-category breakdown that sorts by total time lost.
- Visual Rollup — See child-state distribution of work items grouped by parent, from any shared query.
Each plugin does one thing well and is free on the Marketplace.
AgileViz Cycle Time by Board Column
While you’re here, check out AgileViz Cycle Time by Board Column.
- See exactly where your process is slow or unpredictable.
- Real time view of delays — before they get out of control.
- AI analysis gives you insights and asks questions to help your team improve.
Try it free, no credit card needed, learn more.