Visual Rollup is an Azure DevOps (ADO) dashboard widget that visualizes progress on Parent work items based on the states, counts, and sizes of their child work items.
Work items are selected by a user-defined query, giving you full control over what the widget shows: what’s in your sprint, how your Features are rolling up, or anything else you can query.
Visual Rollup gives you a high-level, visual status of work in progress with click-through to details in ADO.
Installing Visual Rollup
Install Visual Rollup from the Microsoft Visual Studio Marketplace.
Installation requires organization-level permissions; if you don’t have them, ask your ADO administrator.
The extension uses vso.work scope — read-only access to work items — and does not send data outside your ADO organization.
Once installed, add the widget to any dashboard:
- Edit the dashboard (Edit in upper right).
- Click in the Search widgets input.
- Type Rollup.
- Double click on Visual Rollup.
- Configure the widget — see Configuring the widget below.
Understanding the visual
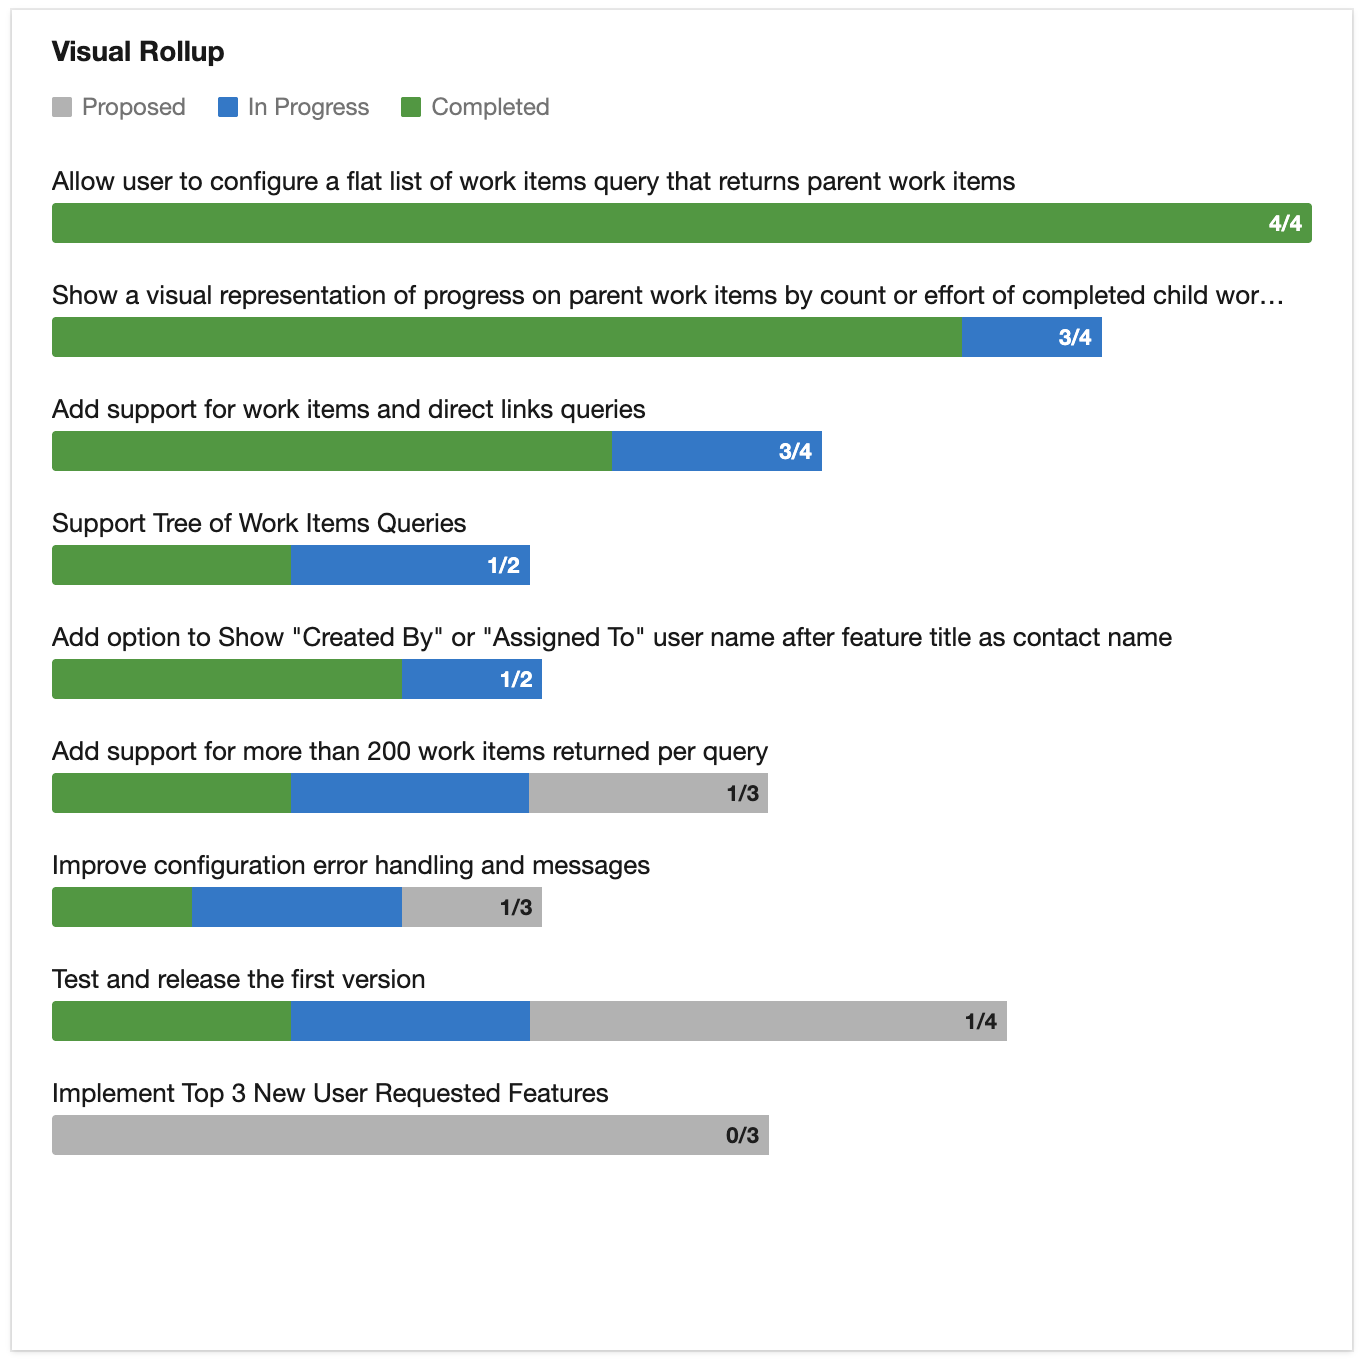
Each parent work item appears as one row with a stacked progress bar showing the state breakdown of its children.
State categories. Visual Rollup groups work item states into three categories — Proposed, In Progress, and Completed — so all work item types display the same way despite differences in state names and counts across work item types and templates.
Bar sizing. When children are backlog items (Product Backlog Items, User Stories, Features, Epics), bar segments are scaled by Effort (Scrum template) or Story Points (Agile template).
Backlog items without Effort or Story Points set are sized to the average of their sized siblings under the same parent — this keeps unsized items visible without distorting the bar.
If none of the children are sized, the bar uses item counts instead of sizes.
When children are Tasks, Visual Rollup uses count of tasks rather than Remaining Work — because Remaining Work drops to zero when a task is marked Done, which would make completed tasks invisible.
“Done / total” label. Each bar shows a done/total count so you can see at a glance how many children are in the Completed state. This label is always a count, whether the bar segments are sized or counted.
Removed items. Work items in the Removed state are excluded from the bar.
Click-through. Clicking any parent title or bar opens that work item in ADO in a new tab.
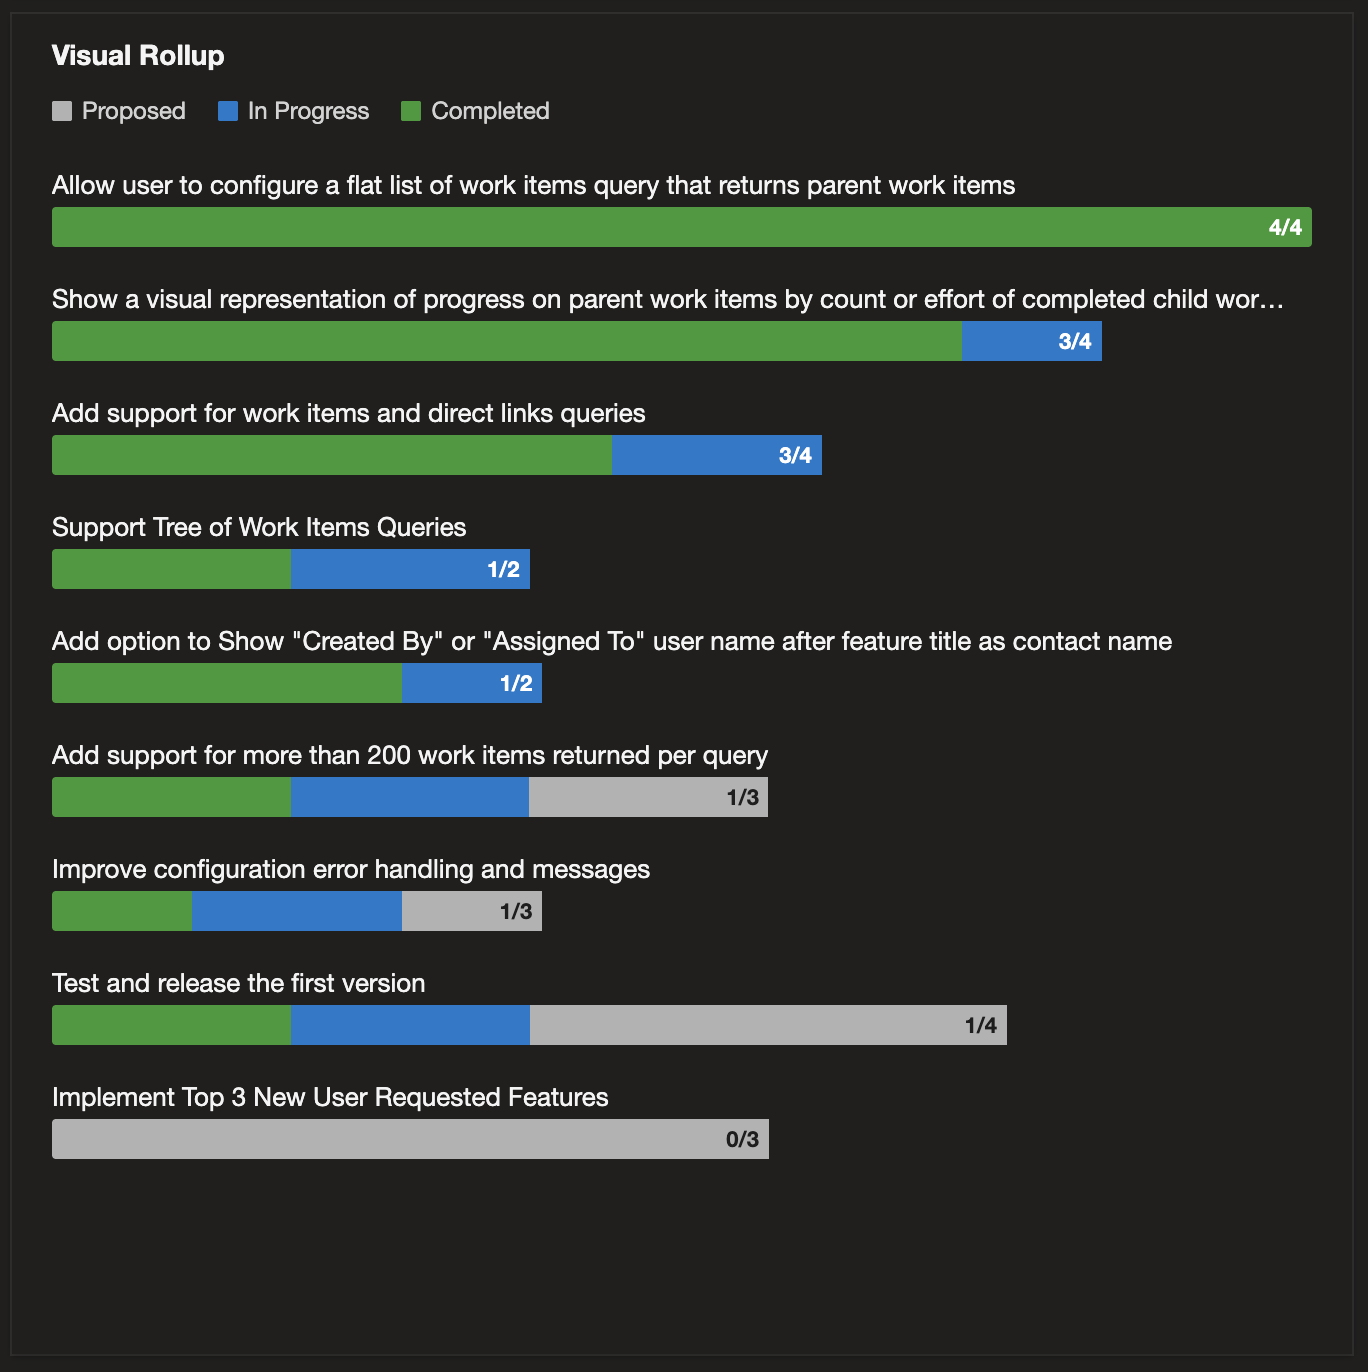
Dark mode. Visual Rollup tracks your ADO theme automatically — the widget adapts to light and dark mode without any configuration.
Configuring the widget
When you open the widget’s configuration pane, you’ll see:
- Widget Title — the label shown at the top of the widget on your dashboard.
- Width and Height — standard ADO widget sizing. Wider widgets give labels more room; taller ones show more parent items before scrolling.
- Query — the shared query that selects which work items to show. You can use any shared query your account has access to. See Query types below for supported formats.
- Display level (tree queries only) — for tree queries, pick which level of the hierarchy shows as the parent row. For example, a tree query with Epics → Features → PBIs can roll up at the Epic level (shows Features as bars) or the Feature level (shows PBIs as bars).
- Name on work items — optionally show the Assigned To or Created By name after each parent’s title. Set to None (the default) for an uncluttered look.
- Work Item Sorting — order parent items by Priority, or by how much of their work is in each state category (Proposed first, In Progress first, or Completed first).
Query types
Visual Rollup supports all three ADO query types, each with different rollup behavior:
Flat list of work items. All work items in the query result are treated as parents. Children are discovered automatically via ADO’s work item links. Good for “show me all Features in the current release.”
Work items and direct links. Parent/child relationships come from the query result itself. Children not included in the query are not shown — this lets you filter which children count. Good for “show me these specific Features and only the Tasks assigned to my team.”
Tree of work items. The query returns a hierarchy. Use the Display level option to pick which level becomes the parent row; the level directly below rolls up as their children. Good for “show me Epics with Features rolled up” or “show me Features with PBIs rolled up.”
Common questions
What does Visual Rollup write to my work items?
Nothing. Visual Rollup is read-only — it runs your selected shared query and renders the results as stacked bars. No tags, comments, fields, links, or work item content is modified. The only stored state is the widget’s configuration (which shared query, which work item type, etc.) on your dashboard.
Does Visual Rollup work with Azure DevOps Server (on-premises)?
Officially supported for Azure DevOps Services (cloud). The marketplace listing targets the cloud edition; the plugin isn't currently distributed through the on-premises marketplace. There are no known technical limitations that would prevent it from working on Azure DevOps Server, but I haven't validated it against the on-premises edition. If you need on-prem support, contact me and we'll work through it together — likely starting with a version check (the modern Azure DevOps Extension SDK that this plugin uses requires Azure DevOps Server 2019 or later).
Why is my widget empty?
Most commonly, the query returns no work items. Open the query in ADO and verify it returns results in the current org and project context. Other possibilities: all returned items are in the Removed state (excluded by design), or the parent work items have no children linked.
Why are some children missing?
If you’re using a Work items and direct links query, only the children included in the query appear. Switch to a Flat list or edit your query to have all children shown.
Why do the bar sizes look off?
Visual Rollup uses Effort or Story Points on backlog items. Unsized backlog items are sized to the average of their sized siblings — helpful when a few items are missing estimates, noticeable when most are. If sizes still look wrong, check that Effort or Story Points is set consistently on your backlog items.
Can I use Visual Rollup with Tasks?
Yes. Task bars use item counts because Tasks’ Remaining Work drops to zero on Done — counts keep completed tasks visible.
How do I refresh the widget?
The widget refreshes automatically when the dashboard loads. For a manual refresh, press the refresh icon (circular arrow) or refresh the browser.
Getting direct help
Email me directly. Use the contact form and describe:
- The problem you experienced.
- Steps to reproduce it.
- Expected vs. actual behavior.
- Any other relevant context.
Ask publicly. The extension’s Q&A tab on Marketplace is good for questions you’re happy having others find and benefit from. I answer those too.
Other free AgileViz plugins
While you're here, browse the AgileViz plugin portfolio:
- Blocker Buddy — Capture why and how long your team's work is blocked, with a per-category breakdown that sorts by total time lost.
- Throughput — Items completed per sprint, month, or quarter — with the trend over time and breakdown by work item type.
Each plugin does one thing well and is free on the Marketplace.
AgileViz Cycle Time by Board Column
While you’re here, check out AgileViz Cycle Time by Board Column.
- See exactly where your process is slow or unpredictable.
- Real time view of delays - before they get out of control.
- AI analysis gives you insights and asks questions to help your team improve.
Try it free, no credit card needed, learn more.